5 Best Small-Cap Stocks to Buy Today
| Company (Ticker) | 12 Week Price Change | Forward PE | Price | Proj EPS Growth (1 Year) | Projected Sales Growth (1Y) |
|---|---|---|---|---|---|
| Universal Insurance Holdings (UVE) | 36.65% | 7.20 | $33.59 | 158.66% | 3.19% |
| LendingTree (TREE) | -24.92% | 10.66 | $55.16 | 50.05% | 20.48% |
| CorMedix (CRMD) | -33.78% | 3.43 | $9.40 | 1,055.57% | 612.66% |
| Kaiser Aluminum (KALU) | 19.53% | 15.86 | $96.16 | 133.86% | 14.09% |
| Great Lakes Dredge & Dock (GLDD) | 3.52% | 11.01 | $12.38 | 30.56% | 11.61% |
*Updated on November 25, 2025.
Universal Insurance Holdings (UVE)
$33.59 USD +0.26 (0.78%)
3-Year Stock Price Performance
Premium Research for UVE
- Zacks Rank
- Strong Buy 1
- Style Scores
A Value A Growth D Momentum A VGM
- Market Cap:$934.87M
- Projected EPS Growth:158.66%
- Last Quarter EPS Growth: 10.57%
- Last EPS Surprise:23.64%
- Next EPS Report date: Feb. 24, 2026
Our Take:
Universal Insurance is increasingly standing out among expanding P&C players, supported by a strict underwriting discipline and a business model that leans strategically on third-party reinsurance. The company, valued at $935.7 million, is showing sharply improving fundamentals as loss ratios decline, investment income climbs and earned premiums continue to strengthen.
A Zacks Rank #1 (Strong Buy) reflects positive estimate revisions, while Style Scores of A for Value and Growth balance a middling C for Momentum, consistent with a value-led insurer benefitting from firming rates and disciplined reinsurance. Balance-sheet strength and operational execution are supporting its shareholder-friendly moves.
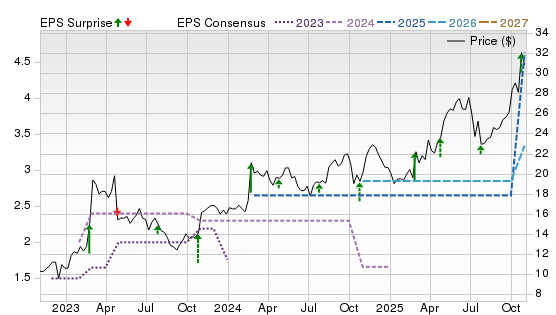
On the Price, Consensus & EPS Surprise chart, shares have trended higher since mid-2024, with 2026–27 consensus lines lifting after a flat 2024–25 base. That pattern, rising out-year estimates leading price, suggests improving earnings power as digital distribution expands its reach and boosts operational efficiency across the business.
LendingTree (TREE)
$55.16 USD +4.14 (8.11%)
3-Year Stock Price Performance
Premium Research for TREE
- Zacks Rank
 Strong Buy 1
- Style Scores
B Value A Growth D Momentum A VGM
- Market Cap: $697.48M
- Projected EPS Growth:50.16%
- Last Quarter EPS Growth:74.03%
- Last EPS Surprise:38.21%
- Next EPS Report date:March 4, 2026
Our Take:
LendingTree runs a leading online marketplace that matches consumers with lenders across mortgages, personal loans, credit cards and insurance and has a market cap of roughly $691.3 million. Recent results showed double-digit revenue and segment profit growth, while leadership transition following the founder-CEO’s tragic death has kept its growth strategy intact.
A Zacks Rank #1 with Style Scores of A for Growth, B for Value and D for Momentum fits a recovery narrative driven by estimate momentum and operating leverage, even as price momentum remains uneven. Strengthening partner demand, ongoing refinancing to cut interest costs, and a sharper focus on higher-ROI traffic collectively enhance the stock’s appeal. It boasts a network of around 430 financial partners.
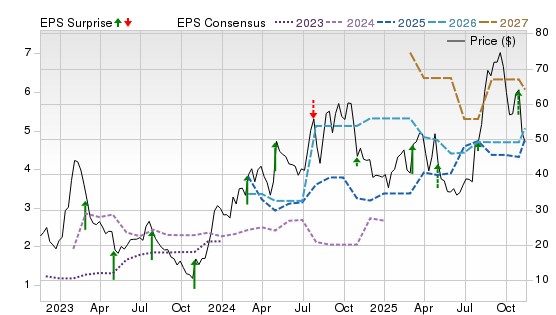
On the chart, the stock has rebounded from 2024 lows as 2025–27 consensus lines stair-step higher. The improving slope of estimates versus a still-volatile price line points to fundamentals outpacing sentiment.
CorMedix (CRMD)
$9.40 USD -0.42 (-4.28%)
3-Year Stock Price Performance
Premium Research for CRMD
- Zacks Rank
 Strong Buy 1
- Style Scores
B Value B Growth A Momentum A VGM
- Market Cap: $773.71M
- Projected EPS Growth:1,066.67%
- Last Quarter EPS Growth:103.57%
- Last EPS Surprise: 18.75%
- Next EPS Report date:March 24, 2026
Our Take:
CorMedix, a commercial-stage biotech, develops DefenCath, an antimicrobial catheter lock for hemodialysis, along with other therapies for severe conditions. The company’s market cap stands at $885.6 million. An expanded prophylaxis indication for REZZAYO could push the addressable market above $2 billion, increasing it nearly eightfold. The Melinta acquisition, completed this September, added portfolio depth and meaningful cost synergies, strengthening both scale and long-term growth momentum.
A Zacks Rank #1 and Style Scores of B for Value and Growth and A for Momentum signal broad-based strength as sales visibility improves under CMS’ TDAPA add-on payment framework and expanding institutional adoption. The setup remains execution-dependent but supported by category leadership.
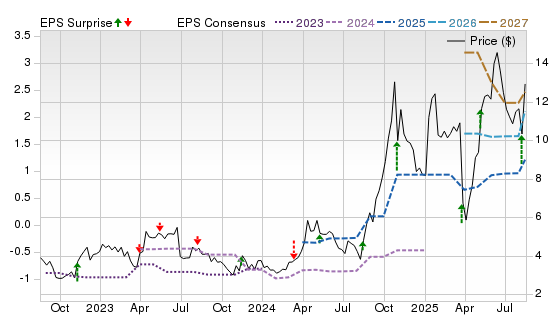
On the chart, the price has recovered from early-2024 troughs as 2026–27 consensus moves materially higher. The widening gap between rising estimates and a lagging but improving share price suggests further room if commercialization continues to scale.
Kaiser Aluminum (KALU)
$96.16 USD +3.08 (3.31%)
3-Year Stock Price Performance
Premium Research for KALU
- Zacks Rank
 Strong Buy 1
- Style Scores
A Value A Growth F Momentum A VGM
- Market Cap:$1.51B
- Projected EPS Growth:133.86%
- Last Quarter EPS Growth: 53.72%
- Last EPS Surprise: 132.50%
- Next EPS Report date: Feb. 18, 2026
Our Take:
Kaiser Aluminum makes specialty aluminum products for aerospace, packaging and industrial markets and has a market cap of almost $1.5 billion. Growing demand in space, defense and packaging fields will keep its margins growing. Its EBITDA margin jumped 450 basis points to 20.4% in the first nine months of 2025. During this time, its realized price per pound increased 14% year over year.
A Zacks Rank #1 with Style Scores of A for Value and Growth offset an F for Momentum, consistent with a cyclical upturn that is clearer in estimates than in near-term trading. Recent updates pointed to improved profitability and pricing, reinforcing earnings normalization.
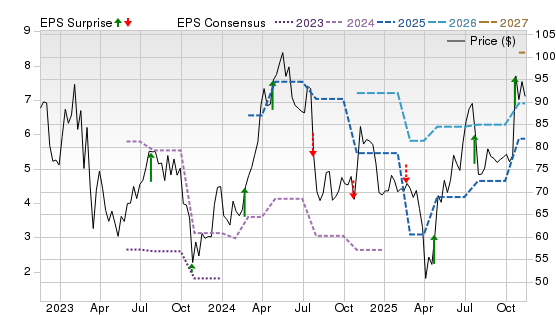
On the chart, shares have climbed steadily while the 2027 consensus inflects higher after a flat 2025–26. With the Trentwood Phase VII expansion project expected to be completed in the early fourth quarter, shipments will likely improve.
Great Lakes Dredge & Dock (GLDD)
$12.38 USD +0.31 (2.57%)
3-Year Stock Price Performance
Premium Research for GLDD
- Zacks Rank
 Strong Buy 1
- Style Scores
A Value A Growth B Momentum A VGM
- Market Cap:$820.75M
- Projected EPS Growth: 30.95%
- Last Quarter EPS Growth: 85.71%
- Last EPS Surprise:52.94%
- Next EPS Report date: Feb. 17, 2026
Our Take:
Great Lakes is the largest U.S. provider of capital and coastal-protection dredging, with a market cap of $806.5 million. A hefty backlog concentrated in higher-margin capital and coastal work and LNG-linked port projects underpins multi-year revenue visibility. Around 46% of revenue is being generated from capital projects, along with 33% from coastal protection and 21% from maintenance projects. The coastal protection alone commands 57% of the bid market share.
A Zacks Rank #1 and Style Scores of A for Value and Growth, with B for Momentum, reflect estimate upgrades tied to margin expansion and disciplined bidding. Recent quarters highlight improving profitability as the mix shifts toward large-scale projects. Delivery of Acadia is expected next year, which will service the growing offshore energy industry.
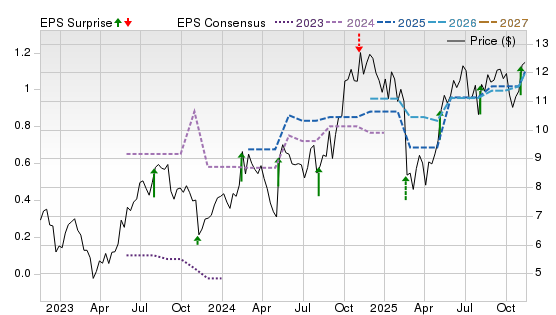
On the chart, price strength has accelerated alongside rising 2026–27 consensus lines. That tandem move, backed by backlog, suggests fundamentals continue to lead the tape.
Methodology
The Zacks Rank is a proprietary stock-rating model that uses trends in earnings estimate revisions and earnings-per-share (EPS) surprises to classify stocks into five groups: #1 (Strong Buy), #2 (Buy), #3 (Hold), #4 (Sell) and #5 (Strong Sell). The Zacks Rank is calculated through four primary factors related to earnings estimates: analysts' consensus on earnings estimate revisions, the magnitude of revision change, the upside potential and estimate surprise (or the degree in which earnings per share deviated from the previous quarter).
Zacks builds the data from 3,000 analysts at over 150 different brokerage firms. The average yearly gain for Zacks Rank #1 (Strong Buy) stocks is +23.62% per year from January, 1988, through June 2, 2025.
For this list, only companies trading 100,000 shares or more daily and in the top 50% of industries were considered. All stocks had a Zacks Rank #1 rank at the time of selection. All information is current as of market open, Nov. 25, 2025.
Guide to Best Small-Cap Stocks
What Are Small-Cap Stocks?
“Small-cap” refers to publicly traded companies whose market capitalisation falls below a certain threshold. The exact cutoff varies by region or index provider, but commonly in the U.S. small-caps are defined as roughly $300 million to $2 billion in market cap.
Why Invest in Small-Cap Stocks
- Growth potential: Because these companies are smaller, they have more runway to grow revenues, profits and market share.
- Diversification: They often behave differently than large-cap stocks, so including them can enhance portfolio diversification.
- Value opportunity: Many small-caps are currently trading at valuations below historical norms or relative to large caps — offering potential mispricing opportunities.
Small-Cap vs Mid-Cap vs Large-Cap Stocks
Small Cap:
- Market capitalization of between $300 million to $2 billion (but designation can vary among indices).
- Higher growth potential, but higher risk and less liquidity.
- More volatile and more sensitive to economic and interest rate shifts.
Medium (Mid) Cap:
- Market capitalization generally from $2 billion to $10 billion.
- Balanced between growth and stability.
- Fewer extremes than small caps, but possibly less upside.
Large Cap:
- Market cap is usually over $10 billion.
- Established companies, lower growth but more stability.
Benefits of Investing in Small-Cap Stocks
- Potential for outsized returns if a small company scales successfully.
- Greater market inefficiencies — less analyst coverage means more opportunity for undervalued gems.
- Cyclical upside — when conditions improve (such as lower rates or economic recovery) small caps often lead the trend.
Risks and Challenges of Small-Cap Stocks
- Higher volatility — More price swings, less predictable earnings.
- Sensitivity to economic and interest rate cycles — Small cap companies often carry more floating rate debt, shorter maturities, and weaker financials. Small cap stocks are generally “more vulnerable” in elevated-interest rate environments.
- Less liquidity and coverage — Small cap stocks may be harder to trade, with fewer analysts covering them and less public information
- Greater capital risk — Many small-cap firms are still unprofitable; their future may be less certain.
Small-Cap ETFs vs Small-Cap Stocks
- ETFs: Small-cap exchange traded funds provide instant diversification, lower company-specific risk, simpler to invest.
- Individual stocks: Offer higher potential upside (and higher risk). You can benefit from picking a breakout company, but the odds of mis-steps are higher.
- If you believe in the asset class broadly, a small-cap ETF may be a smarter choice; if you want to hand-pick potential winners and accept higher risk, then individual stocks might appeal.
How to Choose the Best Small-Cap Stocks
Look at factors like:
- Business quality: Profitability (or path to profitability), return on invested capital, competitive advantage (often known as a ‘moat”).
- Financial strength: Manageable debt, good cash flow and reasonable valuation.
- Valuation: Since small caps are currently trading at depressed valuations relative to large caps, finding ones that are both good quality and cheap may give you an edge.
- Sector and cycle fit: Because many small-caps are more cyclical, consider how economic or rate trends might affect them.
- Liquidity and transparency: Ensure the company has sufficient trading volume and good public disclosure.
- Time horizon: Small-cap investing often requires patience — these stocks may take time to execute and get recognised by the market.
How to Invest in Small-Cap Stocks
- Decide your allocation: How much of your portfolio are you willing to place into higher-risk small caps?
- Combined approach: Consider holding a small-cap ETF and a few hand-picked individual names for upside.
- Use dollar-cost averaging to smooth entry over time (given the greater volatility of small cap stocks.)
- Monitor macroeconomic variables: Interest rates, economic growth, inflation, liquidity — these matter for small caps.
- Stay disciplined: Set stop-losses or position limits; avoid over-allocating to speculative names
- Review your time horizon: Small caps typically work better when held for multiple years rather than trading in and out.
Tips for Building a Small-Cap Portfolio
- Diversify across sectors to avoid concentration risk (such as spreading across small-cap healthcare, industrial, consumer stocks and so forth).
- Blend quality and speculative: Have some “core” small-cap holdings with proven businesses plus some high-upside speculative names.
- Watch weighting: Don’t let any one small-cap issue become too big a part of your portfolio.
- Track valuations: Since small-cap valuations can re-rate, be ready to adjust when valuations seem stretched.
- Stay updated on macro shifts: For example, rate cuts can help small-caps more than large caps. Medium term, that dynamic could drive performance.
Frequently Asked Questions About Small-Cap Stocks
How long should I hold small-cap stocks?
Because of their risk and growth nature,a time horizon of 3-5 years or more is generally preferable. Short-term trading can be risky due to volatility and structural shifts.
Are small-cap stocks suitable for beginners?
They can be, but only if the investor understands the risks, is comfortable with volatility and uses appropriate position sizing. Beginners might start with ETFs or limit exposure rather than going heavy into speculative names.
What sectors do the best small-cap stocks usually come from?
Historically: industrials, consumer discretionary, healthcare/biotech, technology. Small caps tend to have more cyclical exposure compared to large caps.
Also note many small-caps fly under the radar.
Can small-cap stocks be dividend-paying?
Yes — though less commonly than large-caps. Many small-cap companies reinvest profits into growth rather than returning dividends. But some mature small-caps may pay dividends.
What is the historical performance of small-cap stocks?
- Historically small-caps offered a “small-cap premium” over large-caps due to greater growth potential.
- However, more recently this premium has eroded — for example, J.P. Morgan reports that the small-cap growth engine has diminished in recent years.
- Still, some data suggests that when macro conditions shift (such as interest rate cuts and economic recovery), small caps tend to outperform large caps.


